
GrowthStack Advisory / Resources / TAM, SAM and SOM
TAM, SAM and SOM: sizing a market in three steps
The short answer
TAM is the whole category, SAM is the part your product and delivery model can serve, and SOM is what you can realistically win in a stated period. The first two are arithmetic and most teams get them roughly right. The third is where plans break, because it usually gets set as a percentage of SAM rather than built from anything. Build it instead from how many accounts your team can work, the win rate you actually achieve against that segment, the sales cycle, and onboarding capacity, then let the percentage fall out as a result. Then treat that figure as a hypothesis rather than an answer: run campaigns against the serviceable market, record why each no was a no, and revise the filters until the list stops producing the same rejection. SOM is discovered, not estimated.
- SOM is an output, not a market share you pick
- Capacity is usually the constraint, and usually the input left out
- Obtainable is a competitive word. Unserved and displacement are not the same market
- Two of three rejections should change your market definition
- It should end in named accounts, not only a number

Founder, GrowthStack Advisory. Ran sales development at Locus, GoComet and Landmark’s Logistiq division, and has since delivered for Easyship, ConvertCart and NuVista AI. LinkedIn.
· 8 min read
What the three numbers are for
Market sizing has a reputation as a fundraising ritual, which is why most teams do it once for a deck and never use it again. That is a waste of the only part that affects next quarter.
Here is the version that shows up in a pipeline. A team contacts a thousand accounts a month and books two or three qualified meetings from them. The outreach is not the problem and more of it will not help, because most of that effort went to accounts that were never going to buy. The work is deciding which accounts deserve the effort before a rep spends it, and the output of that work is not a larger number. It is the same team producing more qualified pipeline from less activity.
The three numbers answer three different questions. TAM asks whether the category is worth entering at all. SAM asks how much of it your product and delivery model can actually reach. SOM asks what you can win in a defined period, and it is the only one of the three that decides anything operationally: how many reps to hire, which territories to draw, what quota is achievable, and which accounts get worked first.
Most teams get the first two roughly right and then guess the third, usually as a percentage of the second. That guess is where the plan breaks, because everything downstream is built on it.
TAM: the total addressable market
Start with the full demand for your product category. Estimate how many companies could plausibly buy something like what you sell, and what each would spend on it in a year. Multiply.
At this stage you are deliberately not filtering. Geography, company size and product fit all come later, and applying them now produces a number that is neither a category size nor a reachable one.
Two practical cautions. Build it upwards from a count of companies and a price rather than downwards from an analyst report, because a top-down figure cannot be checked and usually includes adjacent categories you do not compete in. And use a realistic annual figure per customer rather than a list price, since discounting, contract length and expansion all move it.
TAM is worth calculating once and revisiting rarely. It answers a question you mostly ask at the start.
SAM: the serviceable available market
Now narrow to the companies you can actually serve. In practice this is three filters applied in order, and the order matters because each one is cheaper to run than the next.
- Database filters. Geography, language, company size, industry, and whatever technographic signal matters, such as the platform you integrate with. Cheap, fast, and mechanical. This is what most teams stop at.
- Attachment to the problem. The filter almost nobody applies. For each account that survives the database pass, can you state how the problem your product solves actually shows up in that business? A company can match every firmographic filter and have no version of the problem.
- BANT, as a coarse screen. Budget and need, and specifically whether the need is a must-have or a good-to-have. Good-to-have accounts convert at a rate that will not carry a quota, and separating the two before a rep touches the list is what keeps the SAM accurate.
The sentence worth remembering is that a company can be in your category without being a fit. A business with the problem you solve, running on a platform you do not support, in a country you cannot contract in, belongs in TAM and not in SAM.
This is the step most inflated numbers fail. A SAM that is a large fraction of TAM usually means the filters were applied optimistically, and the overestimate stays invisible until reps have spent a quarter on accounts that were never serviceable.
Running inbound qualification on BANT at Locus, Shobhit Gupta personally screened the inbound for the first seven to eight months before the role expanded, which is where the habit of writing the disqualifying half down comes from. The general method for finding your own filters is building a B2B ICP from closed-won data.
SOM: the serviceable obtainable market
SOM is how much of your SAM you can win inside a stated period. It is the number that matters and the one most often invented.
The invented version looks like this: we will take 5% of the market. That figure is not wrong so much as unfalsifiable. Nobody can argue with it, because it was not derived from anything, and a number nobody can argue with is a number nobody can correct.
The built version comes from four inputs, each of which can be challenged on its own:
- Capacity. How many accounts your team can genuinely work in the period. Reps multiplied by accounts per rep per month multiplied by months. This is usually the binding constraint and is almost always the one left out.
- Win rate against these accounts. Not your blended historical rate. The rate against the segment in question, which differs sharply between an unserved account and one you are displacing a competitor from.
- Sales cycle length. A three year horizon with an eleven month cycle does not contain three years of closing. Deals started in the final cycle do not land inside the window.
- Onboarding and retention capacity. Customers you can sign and cannot successfully onboard are not obtainable market, they are churn with a delay.
Run those four and the percentage of SAM falls out on its own. It is an output rather than an input, and that is the whole difference between a defensible estimate and a round number.
SOM is discovered, not estimated
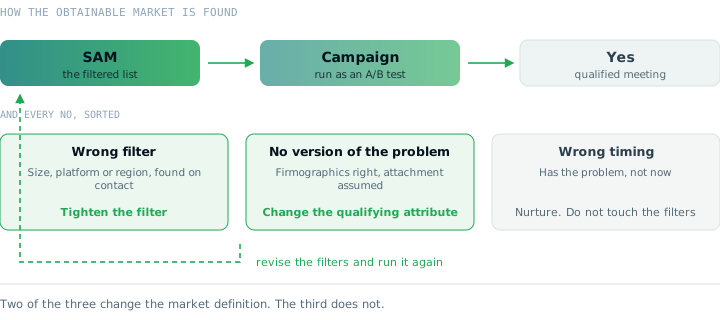
The previous section builds a first estimate from capacity and win rate. That estimate is a starting hypothesis, and the only way to find the real number is to run campaigns against the SAM and read what comes back.
Send to the list. Some accounts say yes, and those become qualified meetings. The useful half is the no, and specifically why it was a no. There are only three answers that matter, and they point at different fixes.
- They do not match the filters after all. Wrong size, wrong platform, wrong region, discovered on contact rather than in the database. The filter was wrong, so tighten it and the SAM shrinks.
- They match, but have no version of the problem. The firmographics were right and the attachment to the problem was assumed. This is the most valuable rejection, because it usually reveals that the real qualifying attribute is operational rather than demographic.
- They have the problem and do not want it solved now. Not a filter failure. A timing answer, which belongs in nurture rather than in a revision of the market definition.
Revise the filters on the first two, leave the third alone, and run it again. After two or three cycles the list stops producing the same rejection and what remains is the obtainable market, established rather than assumed.
Two things make this converge faster. Run the campaign as an A/B test across segments rather than as one send, so a weak result can be attributed to the segment rather than to the copy, and size the test properly, since at cold outbound reply rates a difference between two segments needs more volume than intuition suggests. The cold email A/B test calculator gives the number. And talk to people outside the campaign: feedback calls with prospects who said no, and where you have access to one, an investor network, both of which validate a market faster than another send does.
This is the practical reason SOM cannot be a percentage picked in a planning session. A percentage cannot be wrong in a way that teaches you anything. A filter can.
What to pull from historical data
Every revision above is an argument about which attribute predicts a buyer. That argument should be settled with your own closed-won data rather than with opinion, and the attributes that matter differ by what you sell.
- Everywhere: employee count and revenue band. The blunt instruments, useful mainly for ruling out the ends.
- Financial software: asset size, which predicts both the value of the problem and the ability to pay for it far better than headcount does.
- Logistics and supply chain software: deliveries or shipments per day or per month, and the number of warehouses. Throughput is the qualifying number in this category, and the reasoning is set out in ICP for logistics software.
- Selling to early-stage companies: funding stage and scale stage, which together say whether there is budget and whether there is yet a motion for your product to plug into.
The question to ask of the closed-won list is not what the customers have in common, because plenty of attributes are shared by winners and losers alike. It is which attribute differs between the accounts that bought and the ones that did not, since only that one predicts anything. The same discipline applies to scoring the resulting list, in lead scoring that predicts revenue.
Why competitors decide the obtainable number
This is the part most market sizing skips, and it is the reason SOM cannot be derived from your own capabilities alone. Obtainable is a competitive word, not a descriptive one.
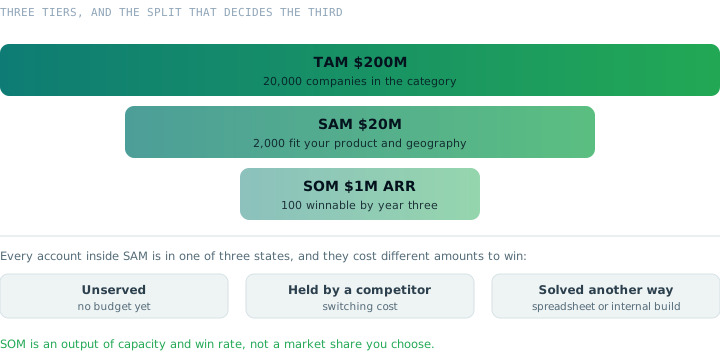
Every account inside your SAM is in one of three states, and they cost completely different amounts to win.
- Unserved. Solving the problem manually, or not solving it. The cheapest to win and the slowest to start, because the buyer has to be convinced the problem is worth budget at all.
- Served by a competitor. A displacement, which needs a reason to switch that outweighs the cost of switching. Longer cycles, lower win rates, and the segment most likely to be overcounted in a SOM.
- Solved another way. A spreadsheet, an internal build, an adjacent tool stretched to cover it. Frequently the largest of the three and almost always the one nobody counted, because the competitor does not appear on any category list.
So the competitor question is not who else sells this. It is which market each competitor actually operates in, where your product and delivery genuinely differ, and what that difference is worth to a buyer who already has something in place. Where the difference is real and specific, displacement accounts belong in SOM. Where it is a feature comparison nobody would switch for, they do not, however many of them exist.
Done properly, this produces something more useful than a number. It produces a list of named accounts, each tagged with which of the three states it is in, which is directly workable by a rep. That is also the real test of the whole exercise: if the sizing does not end in accounts somebody can open next quarter, it was a deck slide rather than a plan.
The positioning work that feeds this sits in ICP, persona and messaging, and the qualification standard that keeps the list accurate is in choosing a qualification framework.
A worked example
Illustrative rather than benchmarked, assuming $10,000 in annual revenue per customer.
- 20,000 companies in the category. At $10,000 each, that is a $200M TAM.
- 2,000 within product and geography scope. One in ten, after filtering for the platform you integrate with, the regions you can contract in and the size where your pricing works. That is a $20M SAM.
- 100 customers by year three. A $1M ARR SOM, which is 5% of SAM. Note the direction of travel: the 5% is the result, not the assumption.
To defend the last line you have to say how those 100 are reached, closed and kept. If two reps can each work 20 new accounts a month, that is 1,440 accounts touched over three years, and 100 customers implies a 7% win rate across them. That is a claim somebody can check and disagree with, which is exactly what a market share percentage is not.
The same arithmetic run backwards is how headcount plans should be built, which is what the pipeline capacity calculator does from a revenue target.
Size it with your own numbers
Interactive tool
TAM, SAM and SOM calculator
SOM is calculated from win rate and team capacity rather than from a market share percentage, so the answer arrives with its assumptions attached.
Defaults follow the illustrative example above and are not benchmarks. The point of the tool is that changing capacity or win rate changes SOM, which is what makes the number defensible.
Where the exercise goes wrong
Four failures, in rough order of how expensive they are.
- SOM as a percentage of SAM. The central one. It inverts the logic, turning the output into the input, and it makes the estimate impossible to correct because there is nothing underneath it to correct.
- Capacity left out entirely. A SOM that exceeds what the team can physically work is a hiring plan disguised as a market estimate, and the gap usually surfaces two quarters in as a pipeline shortfall nobody predicted.
- A SAM drawn too wide. Filters applied optimistically because a larger number reads better. The cost is real: reps spend the quarter on accounts that were never serviceable, and the win rate that comes back is blamed on execution.
- Sizing once and never revisiting. The numbers move when the product gains an integration, when a region opens, or when a competitor changes price. The sizing that justified this year's plan frequently describes last year's product.
One smaller trap worth naming. A TAM assembled from an analyst report cannot be audited, and it usually bundles adjacent categories you do not compete in. Building it upwards from a count of companies takes longer and produces a number you can defend line by line.
Related reading
The filters that decide SAM come from the same work as the ICP: building a B2B ICP that sales actually uses, and ICP, persona and messaging. For a vertical example of a numeric qualifying threshold, see ICP for logistics software.
Once the account list exists, the capacity side is the pipeline capacity calculator and scaling an SDR team. For founders doing this before a first hire, see founder-led sales.
Frequently asked questions
What is the difference between TAM, SAM and SOM?+
TAM is the total demand for your product category, calculated as every company that could plausibly buy it multiplied by what each would spend a year. SAM narrows that to the companies you can actually serve given your geography, language, company size and product requirements. SOM narrows it again to what you can realistically win in a defined period, given competition, win rates, sales cycle length and how many accounts your team can work.
How do you calculate SOM without guessing a market share?+
Build it from capacity and win rate rather than picking a percentage. Take the number of accounts your team can genuinely work in the period, apply the win rate you actually achieve against those accounts, and check the result against sales cycle length so the deals have time to close. The answer then carries its assumptions, and each one can be argued with individually. A figure like one percent of the market cannot be argued with, because it was never derived from anything.
Why does competitor analysis belong in market sizing?+
Because obtainable is a competitive word rather than a descriptive one. Every account in your SAM is either unserved, served by a competitor, or solving the problem another way, and those three cost completely different amounts to win. Sizing the market without knowing which accounts sit where produces a number that describes the category rather than your position in it, and displacement deals in particular run longer and lose more often than greenfield ones.
Is TAM or SOM more useful for go-to-market planning?+
SOM, by a wide margin, for anyone actually building a motion. TAM answers whether the category is large enough to be worth entering, which is a question you usually answer once. SOM decides headcount, territory design, quota and which accounts get worked this quarter. A large TAM with an unexamined SOM is the most common way a plan produces hiring that the pipeline cannot feed.
How big should SOM be as a share of SAM?+
There is no correct ratio, and treating one as a target is the mistake the whole exercise is meant to avoid. The share is an output: it falls out of your capacity, your win rate and the time available. If it looks implausibly small, the useful response is to check whether the SAM was drawn too wide, since most inflated SAMs include companies that are in the category without being a fit.
What should a market sizing exercise actually produce?+
A list of named accounts, not only a number. The point of narrowing from TAM to SAM to SOM is that the final tier is small enough to enumerate, so the exercise should end with the specific companies a rep can open next quarter, each one tagged with whether it is unserved, served by a named competitor, or solving the problem another way.
How do you validate a serviceable obtainable market?+
By running campaigns against the serviceable market and reading the rejections, not by refining the spreadsheet. Three answers matter: the account does not match the filters after all, it matches but has no version of the problem, or it has the problem and does not want it solved now. The first two mean the filters were wrong and the market definition should change. The third is a timing answer and belongs in nurture. After two or three cycles the list stops producing the same rejection, and what remains is the obtainable market.
Which company attributes predict a buyer?+
It depends on what you sell, and the useful test is which attribute differs between accounts that bought and accounts that did not, rather than what your customers have in common. Employee count and revenue band are blunt instruments useful mainly for ruling out the ends. Financial software usually qualifies on asset size. Logistics and supply chain software qualifies on shipments or deliveries per period and the number of warehouses. Selling to early-stage companies, funding stage and scale stage together say whether there is budget and whether there is a motion to plug into.
Turning a market number into an account list
Thirty minutes on which accounts in your segment are genuinely obtainable, and which are not.
Book 30 minutesWritten with AI assistance from Shobhit Gupta’s notes and client work, then reviewed and edited by Shobhit Gupta on .