
GrowthStack Advisory / Resources / GTM reporting dashboard
How to build a go-to-market reporting dashboard: the three-level setup
The short answer
A go-to-market (GTM) reporting dashboard connects sales development activity to qualified pipeline and revenue. Build it in three levels, because each level of management needs a different view: an SDR daily view of activity and engagement, a manager weekly view that keeps activity and conversion on separate dashboards, and a leadership monthly view of pipeline against target, contribution by source, MQL to SQL conversion, SDR throughput and projected revenue. Write the metric definitions before you build anything, build the reports in your CRM, then review them on a fixed cadence: daily, weekly, monthly and quarterly. This is the reporting structure Shobhit Gupta ran at Locus on Salesforce and Salesloft.
- Definitions first: what counts as an MQL, an SQL and a meeting held
- Three views for SDRs, managers and leadership
- Activity and conversion on separate dashboards
- A free template with the formulas built in

Founder, GrowthStack Advisory. Ran global SDR and revenue operations at Locus, including Salesforce administration and the annual operating plan, and set up the global reporting structure at GoComet with its founder and CBO. LinkedIn.
· 10 min read
What is a GTM reporting dashboard?
A GTM reporting dashboard is the set of reports a revenue team uses to see whether its go-to-market work is producing qualified pipeline and revenue. Here GTM means go-to-market, the sales and marketing motion; it has nothing to do with Google Tag Manager, which shares the abbreviation and often turns up in the same searches.
The useful version is a small set of views, each built for one audience and one decision. An SDR needs to know what to do today. A manager needs to know which rep has which problem this week. A founder or head of sales needs to know whether the pipeline will hit the number and whether the team has the capacity to get there. One dashboard cannot answer all three questions well, which is why the setup below has three levels.
Step 1: Write the definitions down before you build anything
Every number on a GTM dashboard depends on a definition someone wrote down, or failed to. Before you open your CRM, agree in writing with marketing and sales what counts as an MQL, what counts as an SQL, what counts as a meeting held, and which date a lead is counted on. Put the definitions where the whole team can see them; the template on this page has a Definitions tab for exactly this.
The SQL definition matters most, because it sits between marketing and sales. At Locus it had four criteria, which Shobhit described this way:
“The qualification criteria were these. First, the person should be relevant on the decision bench: either an influencer or a decision maker. The second criterion is that they should have a valid pain point. At Locus they sell AI route planning and route optimization software, so they should have a valid problem of having a number of riders or delivery persons for whom they had to make the route plans, and they’re doing it on Excel sheets and all. The third qualifier is that they are looking for a solution within the next six months, and the fourth is that they have a relevant budget for it.”
Then fix the formulas. MQL to SQL conversion is SQLs divided by MQLs, multiplied by 100, counted over the same cohort of leads. Reply rate is replies divided by emails delivered, per sequence. SQLs per SDR is the month’s SQLs divided by the SDRs working that month. How to write qualification criteria two reps will grade the same way is covered in the sales qualification framework, and the full MQL to SQL method in improving MQL to SQL conversion.
Step 2: Decide who reads which view
Shobhit’s rule for this, from running global SDR and revenue operations at Locus:
“At Locus, I followed a simple reporting philosophy: different management levels need different dashboards, but all reporting should connect SDR activity to qualified pipeline and revenue.”
In practice that gives three views. The SDR view is for the rep and is read every day. The manager view is read every week, rep by rep. The leadership view is read every month, with a capacity check every quarter. Each step below builds one of them.
Step 3: Build the SDR daily view
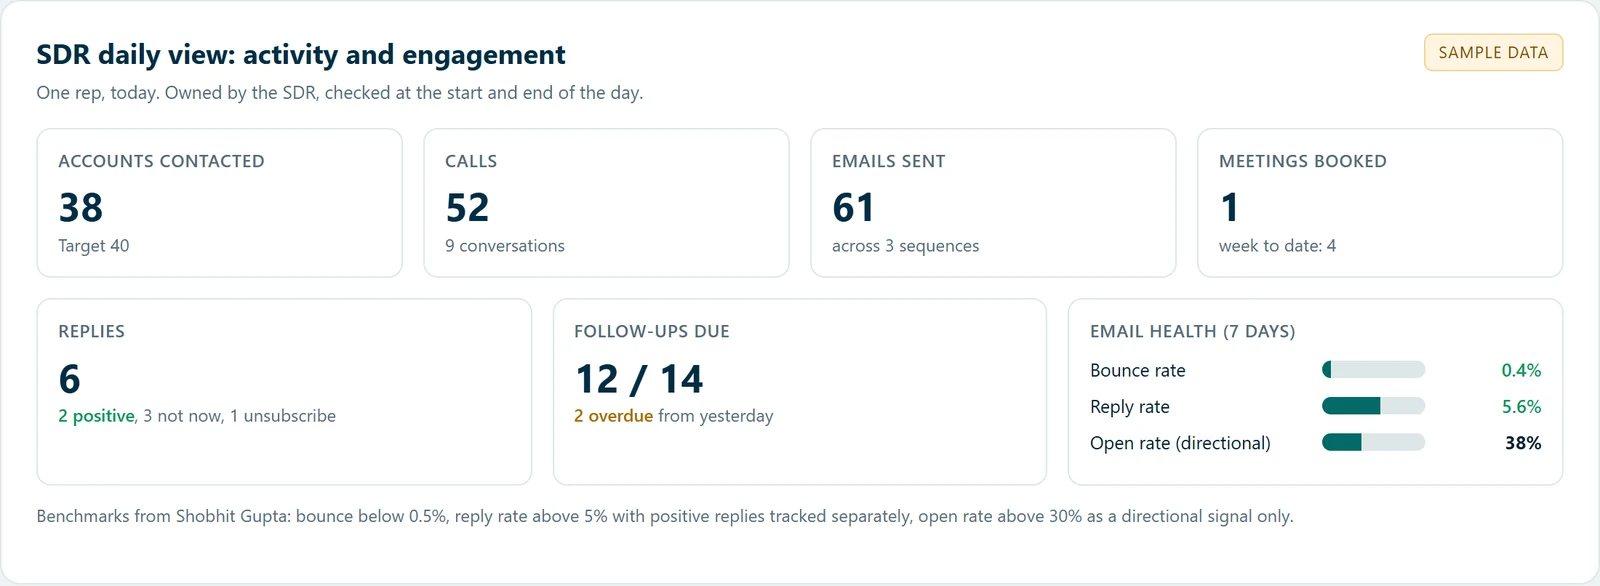
The SDR view tracks the day’s work and whether it is landing. At Locus it covered these numbers:
“We tracked accounts contacted, calls, emails, conversations, replies, follow-ups, and meetings booked. The objective was to understand the relationship between activity and outcomes, rather than simply measuring how many calls or emails an SDR completed.”
Add email health to the same view, so a rep sees a deliverability problem before it costs a week of outreach. The benchmarks GrowthStack uses, in Shobhit’s words:
- Bounce rate: Below 0.5%
- Open rate: Above 30% as a directional indicator, not a definitive measure of inbox placement
- Reply rate: Above 5%, while separately tracking positive replies and qualified meetings
What fixes a falling reply rate is in the cold email deliverability checklist.
Step 4: Build the manager weekly view, with activity and conversion apart
The manager view is where most dashboards go wrong, because activity and conversion end up in one table and a busy rep looks like a successful one. At Locus they were split:
“Using Salesforce CRM dashboards and Salesloft reporting, we monitored individual SDR productivity, inbound versus outbound performance, lead qualification, conversation rates, meetings booked, and SQLs generated.
We separated activity dashboards from conversion dashboards so managers could identify whether the problem was targeting, messaging, outreach execution, or qualification.”
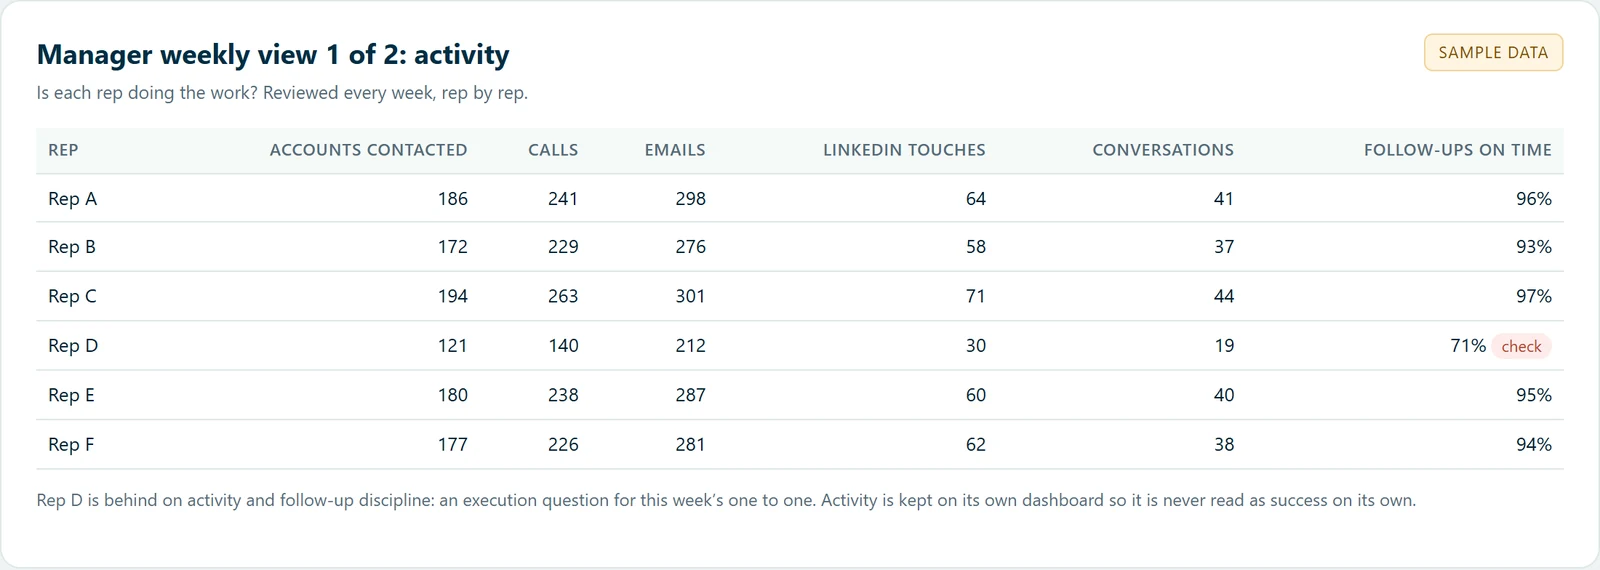
Build two dashboards with the same reps in the same order. The first answers whether each rep is doing the work.
The second answers whether that work is turning into qualified pipeline.
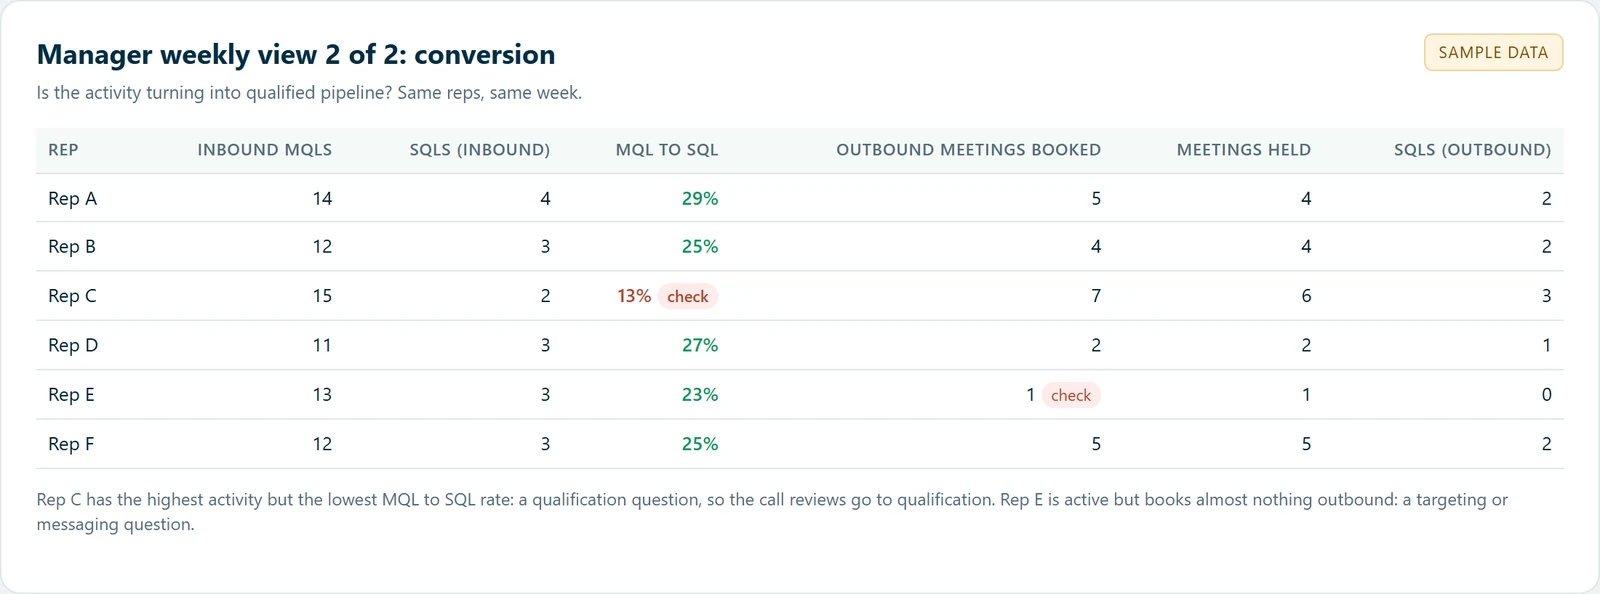
Read together, the two views point each rep to a different conversation. High activity with low conversion is a targeting, messaging or qualification question. Low activity with healthy conversion is an execution question. Both low usually means the rep needs help with the basics. The five checks to run before deciding a rep is the problem are in the SDR performance diagnostic.
Step 5: Build the leadership monthly view
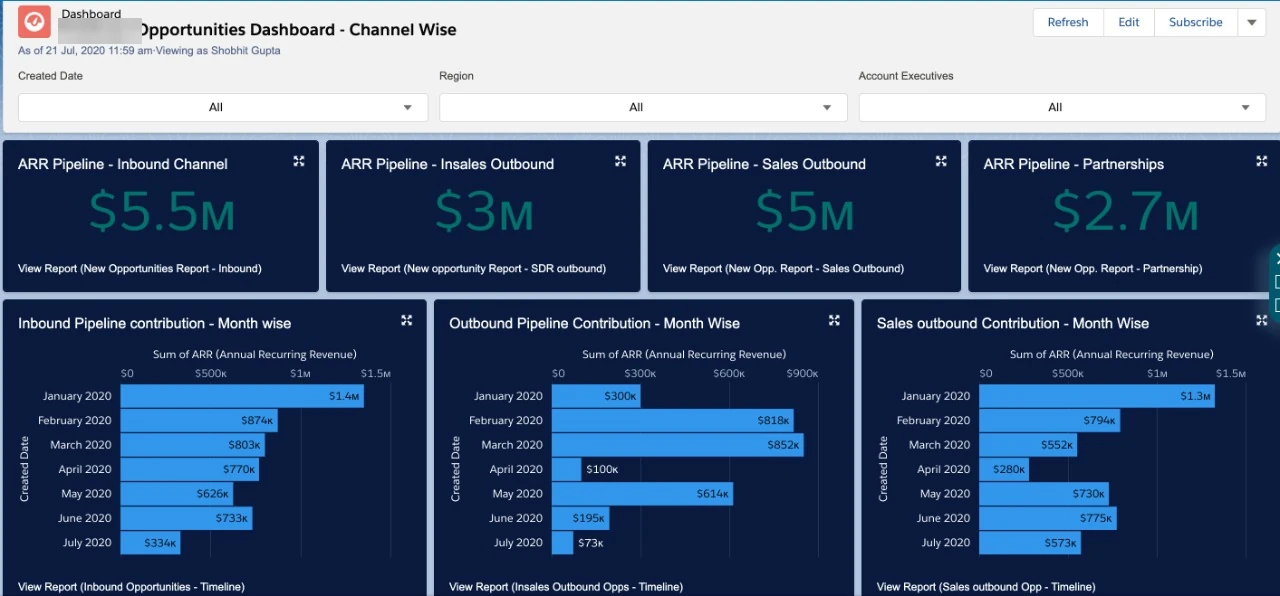
The leadership view answers two questions: will the pipeline hit the number, and does the team have the capacity to get there. At Locus it held these:
“For senior leadership, we consolidated pipeline generation versus targets, source-wise contribution, MQL-to-SQL conversion, SDR throughput, and revenue projections.
During annual operating planning, we also developed SDR hiring and capacity forecasts based on expected individual productivity and pipeline requirements.”
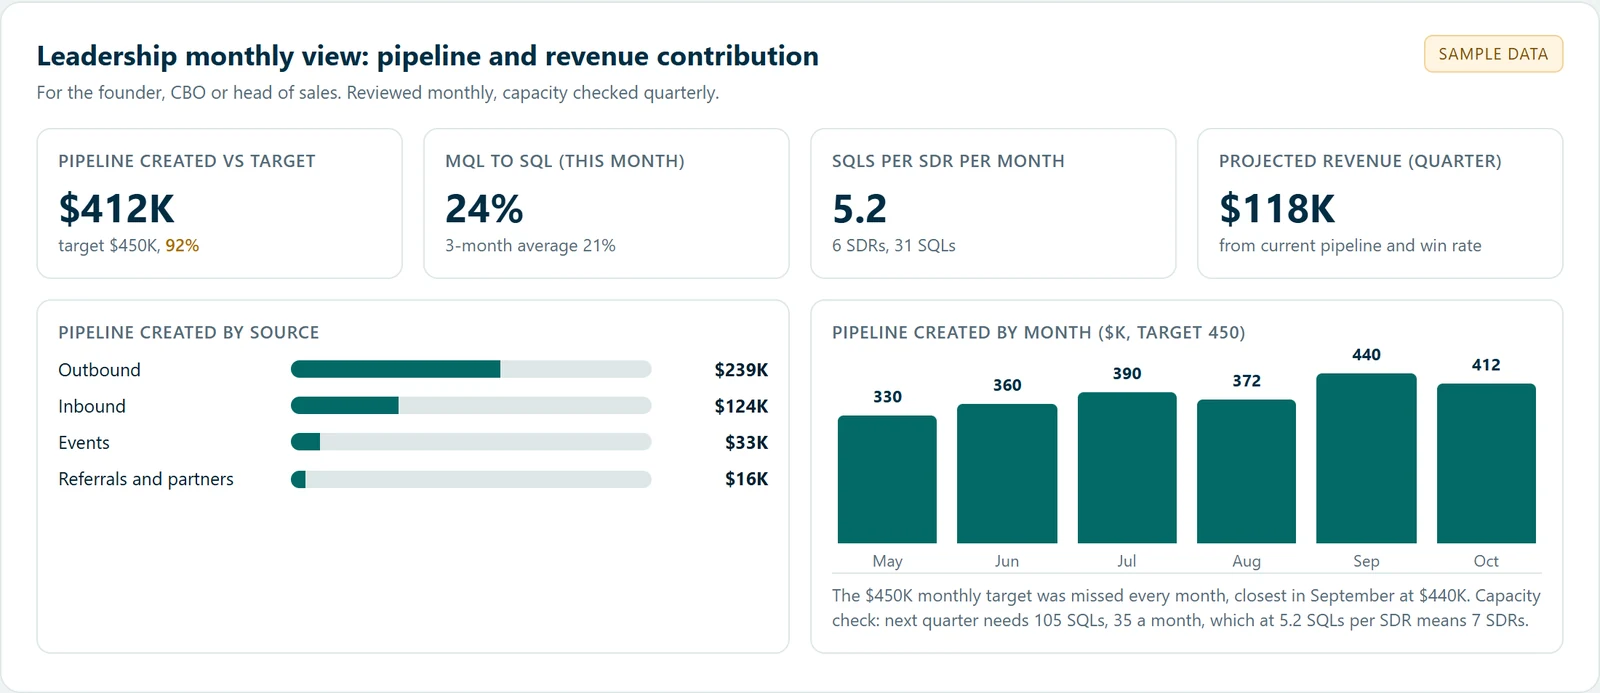
Source-wise contribution is the number most teams cannot state. At Locus, the $20M in sales opportunities created over three years split roughly 40% inbound and 60% outbound, and knowing that split is what told the team where to invest. For the capacity check, the pipeline calculator works backwards from a revenue target to the SQLs and SDRs it needs.
Step 6: Set the review cadence
A dashboard only changes decisions when someone reviews it on a fixed rhythm. The cadence GrowthStack runs with clients, in Shobhit’s words:
- Daily: Monitor outreach execution, replies, and conversations.
- Weekly: Analyze channel performance, ICP response, messaging effectiveness, and SDR productivity.
- Monthly: Evaluate meetings booked, qualified meetings delivered, funnel conversion, and pipeline generated.
- Quarterly: Review pipeline coverage, revenue contribution, capacity planning, and GTM investment decisions.
Match the cadence to how fast each number can move. Shobhit separates the two speeds:
“Campaign improvements can happen within days, sometimes even the same day. If we’re targeting the right ICP but getting poor engagement, refining messaging, subject lines, personalization, or account selection can start changing response patterns quickly.
However, meaningful funnel conversion improvements generally need 30–45 days to implement changes, generate sufficient activity, and evaluate the results.”
So read reply rates and conversations week over week, and judge meeting-to-SQL conversion and pipeline contribution month over month. A change to qualification judged after one week will look like it failed.
How to build it in HubSpot or Salesforce
In HubSpot
Creating or editing dashboards needs Super Admin or the Reports and dashboards permission, and dashboard access does not override the sharing settings on individual reports (HubSpot: manage dashboards). Create one dashboard per level from Reporting, then Dashboards. Build the reports first, then add each to its dashboard from the Actions menu with Add to dashboard. Custom single-object reports, funnel reports and the custom report builder are Professional and Enterprise features (HubSpot: create custom reports), so the MQL to SQL funnel needs one of those plans. Use the lifecycle stage property for MQL and SQL (HubSpot: lifecycle stages) and a funnel report broken down by original source for the conversion view.
In Salesforce
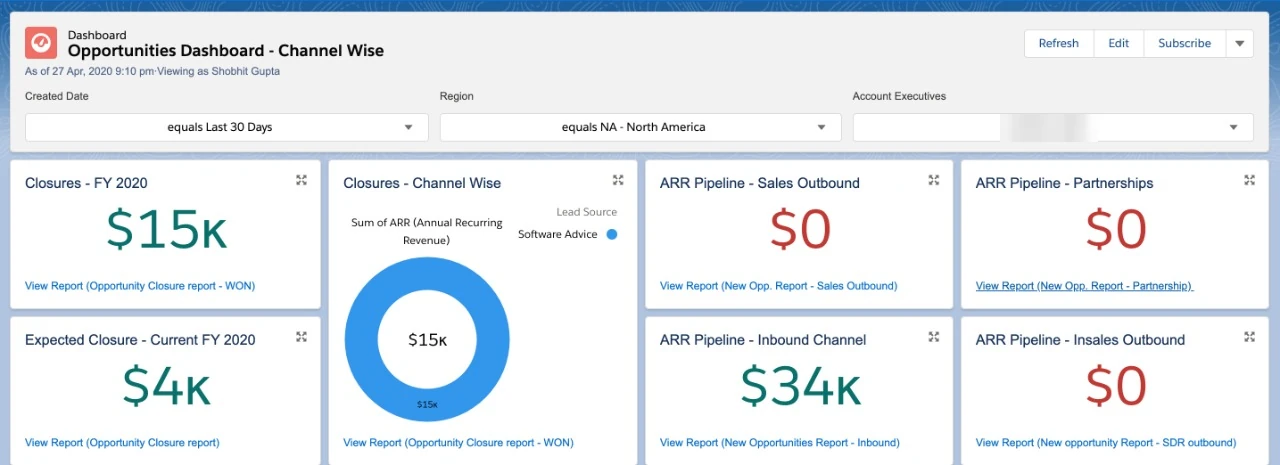
Building a Lightning dashboard needs the Run Reports and Create and Customize Dashboards permissions. Create the source reports first and store them in folders the viewers can access, then go to the Dashboards tab and click New Dashboard. Each widget takes one source report, so build one report per number. Set View Dashboard As carefully: Salesforce warns that viewers can see more or less data than they would elsewhere, which matters when a manager view is shared with reps (Salesforce: build a Lightning Experience dashboard). At Locus, manager reporting combined Salesforce dashboards with Salesloft’s own reporting for sequence activity.
Whichever CRM you use, the dashboard is only as true as the data underneath it. Setting up stages, required fields and reporting is what HubSpot and Salesforce setup covers, and the choice between the two is in HubSpot vs Salesforce.
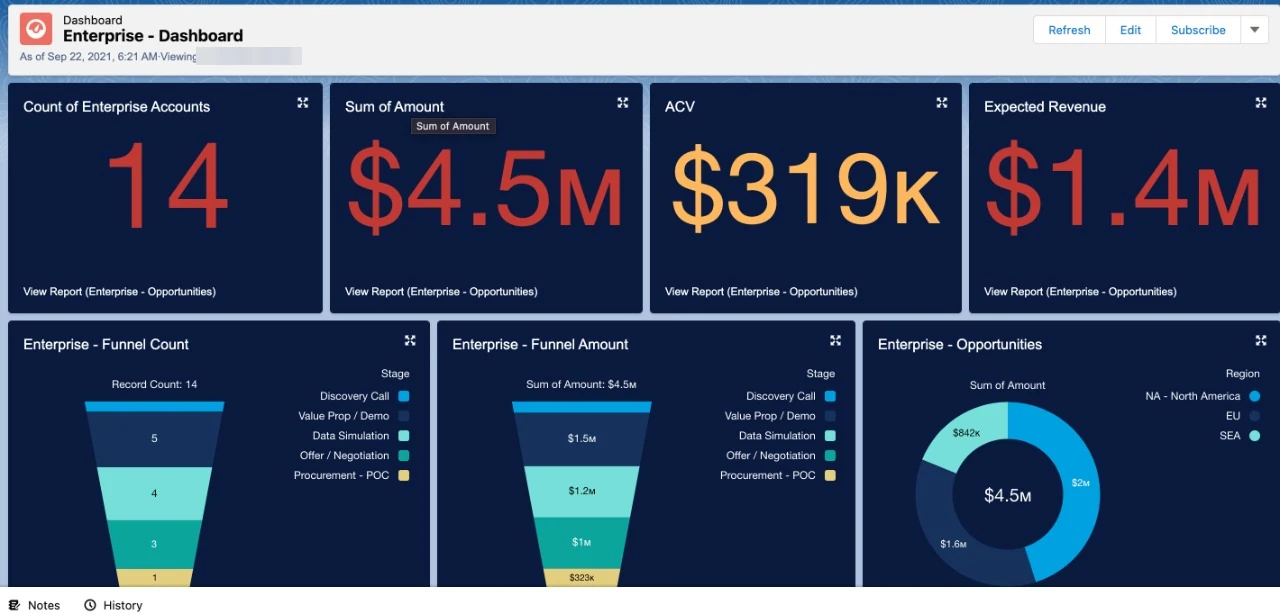
Four mistakes that make a GTM dashboard mislead
Treating activity as success. Calls and emails show effort. The point of tracking them is the relationship between activity and outcomes, so every activity number needs a conversion number beside it on the manager’s other dashboard.
Showing activity and conversion in one table. A combined table rewards the busiest rep and hides the difference between an execution problem and a qualification problem. Keep them on separate dashboards with the same reps in the same order.
Reporting totals without a breakdown. A team-level MQL to SQL rate cannot tell you which source, segment or rep is leaking. Break conversion down by source, segment, stage and owner, which is also where a pipeline audit starts.
Judging funnel changes too early. Messaging changes show up in days; conversion changes need 30 to 45 days of activity before they can be judged. Decide the review date before you make the change.
How this ran at Locus and GoComet
At Locus, Shobhit ran revenue operations alongside the SDR function: Salesforce administration, data migration, and the annual operating plan with the founder’s office. Reporting ran at the three levels above, with conversion reported by source and by rep. Over three years the team created more than $20M in new sales opportunities, MQL to SQL conversion improved from 10% to 25%, and lead to closure improved from 5% to 11%. The reporting is what made those numbers visible; the qualification standard in step 1 is what moved MQL to SQL.
At GoComet, he established the global reporting structures and KPI alignment with the founder and CBO, and built reporting frameworks with the marketing and product teams that aligned KPIs across departments, while the SDR team grew from 10 to 23 across the US, India and South East Asia. Average output rose from 2 to 6 SQLs per SDR per month, which he describes as a team-level result of coaching, stronger processes and consistent performance management. The full story is in scaling an SDR team from 10 to 23.
Download the template
The free template has the same three levels as this guide, with a Definitions tab, an SDR daily log, separate weekly activity and conversion tabs, a leadership monthly tab, and a quarterly capacity check. Yellow cells are inputs and green cells are formulas, so MQL to SQL, pipeline against target and SQLs per SDR calculate as you fill it in. It opens in Excel and Google Sheets.
References
Related reading
Frequently asked questions
What should a GTM reporting dashboard include?+
Three views. An SDR daily view of accounts contacted, calls, emails, conversations, replies, follow-ups and meetings booked. A manager weekly view with activity and conversion on separate dashboards. A leadership monthly view of pipeline created against target, pipeline by source, MQL to SQL conversion, SQLs per SDR and projected revenue.
How often should a GTM dashboard be reviewed?+
Daily for outreach execution, replies and conversations; weekly for channel performance, ICP response, messaging and SDR productivity; monthly for meetings, qualified meetings, funnel conversion and pipeline; and quarterly for pipeline coverage, revenue contribution, capacity planning and GTM investment.
How do you calculate MQL to SQL conversion rate?+
Divide the number of SQLs by the number of MQLs and multiply by 100, counting the same cohort of leads. Write down what qualifies as an MQL and an SQL before you report the rate, or the number changes with whoever is counting.
Why separate activity dashboards from conversion dashboards?+
So a manager can tell what kind of problem a rep has. High activity with low conversion points to targeting, messaging or qualification; low activity points to execution. Shown together, a busy rep looks successful even when nothing is converting.
Can you build a GTM dashboard in HubSpot Starter?+
Only partly. HubSpot lists custom single-object reports, funnel reports and the custom report builder as Professional and Enterprise features, so a funnel view of MQL to SQL needs one of those plans. Starter teams can keep the same three levels in a spreadsheet, such as the free template on this page.
Want the dashboards built for you?
We write the definitions with your marketing and sales leads, build the three views in HubSpot or Salesforce, and set up the review cadence with your team. That is GTM analytics and reporting.
Book a Call